Table of Contents
Graphivac
Graphivac is a software to make and visualize HVAC drawings.
A free version can be downloaded from HVAC.IO.
First time in Graphivac? You probably want to check the Editor instructions
Controls
These are universal controls and should work in all modes.
- Pan : Ctrl+Alt+Click or W A S D or ↑ ← → ↓ or Mouse wheel click
- Zoom : Mouse wheel
- Fullscreen : F11
- Snapshot : Ctrl+P
- Show all : Ctrl+Alt+W
Modes
Graphivac is designed to be able to support new modes as time goes by. Every mode can render objects differently and show different information, while using the same basic drawing.
By default, Graphivac comes with 3 built-in modes:
- Historical (uses Vigilia to show historical data)
It's important to note that Graphivac is not limited to those 2 software; alternative live/historical APIs can be added with new modes.
As of March 2017, the first sponsored mode is also included:
SAEB features tools to group and categorize the various objects and help an external optimization software.
Components
The grids can be populated by components, each with their own characteristics.
Objects (Symbols)
Objects are 1×1 components used to display various symbols.
While Graphivac comes with a few built-in symbols, the user is free to overwrite them and add new ones.
Conduits (Ducts/Pipes)
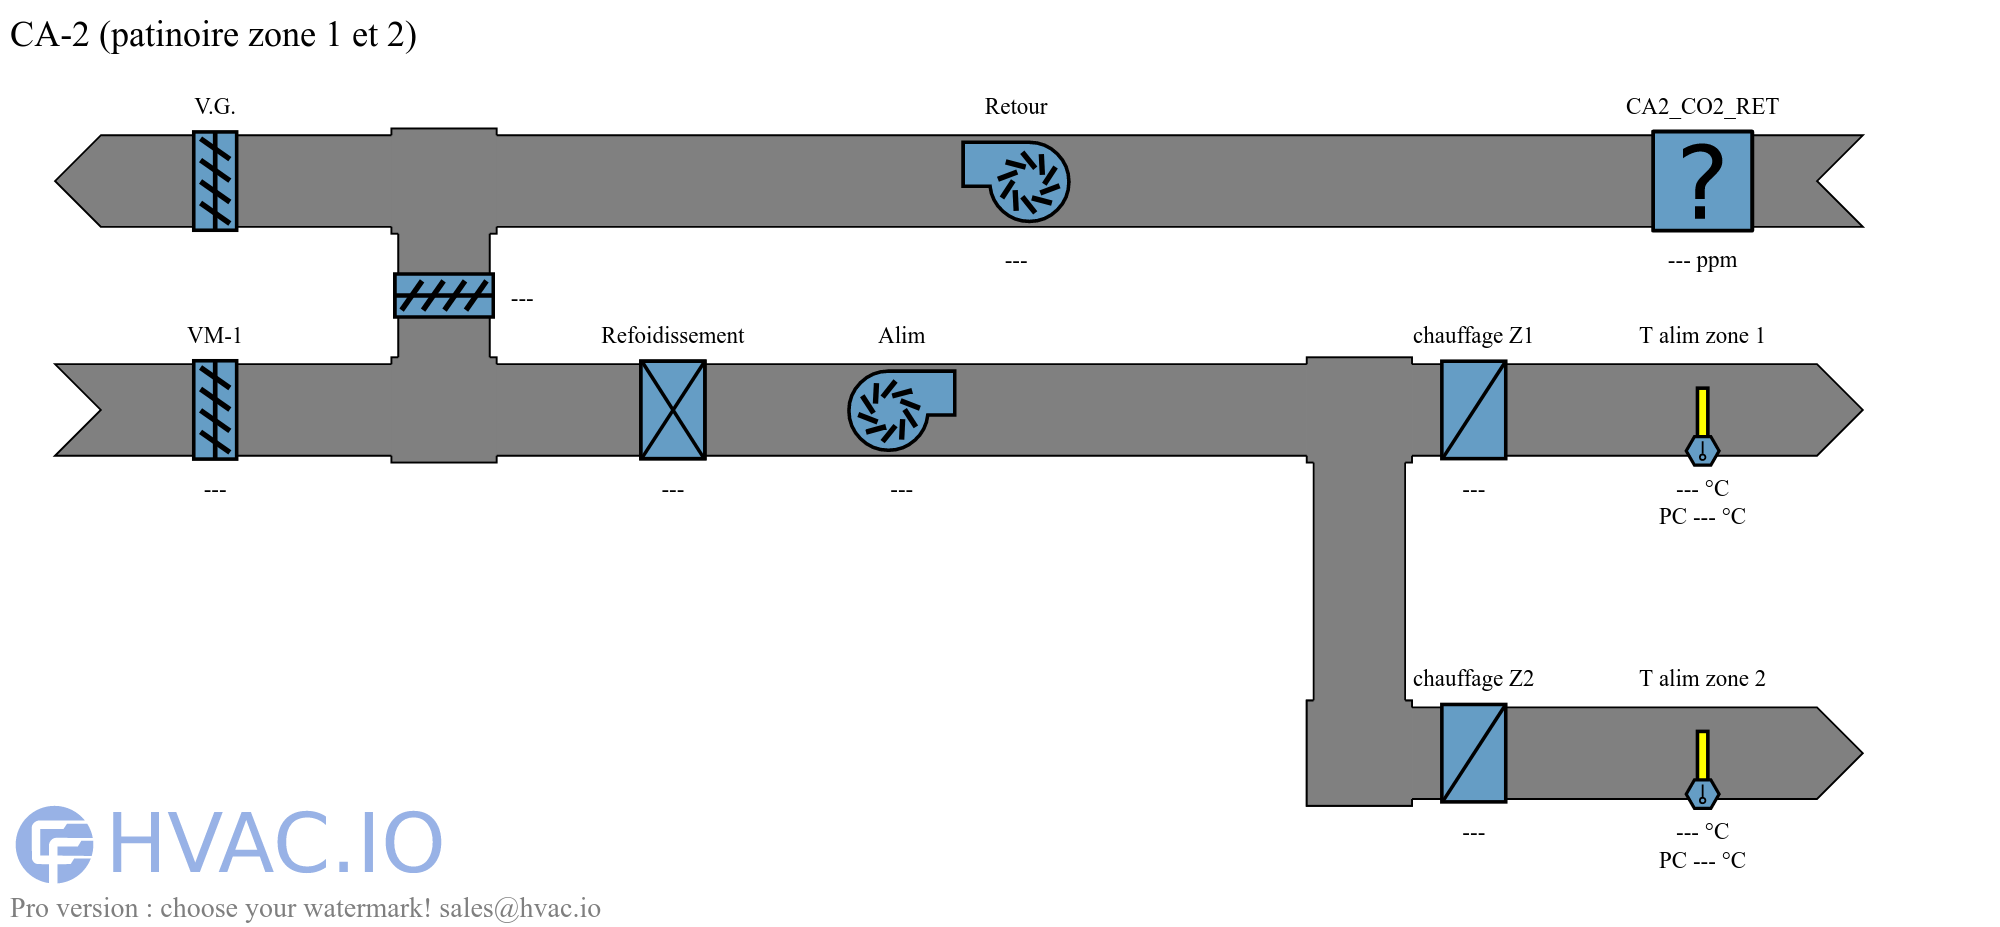
Conduits are arbitrary long, but always 1 unit in width. When a conduit ends on another conduit of the same type, it connects with it. This behavior can be seen below:
Templates
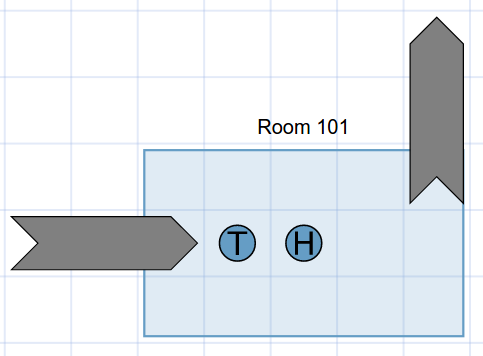
Templates are used when a representation should be used multiple times. The typical use of this component is to show rooms.
You draw a typical room and then specify how many times it should be repeated, along with names and possibly BACnet links.
Enclosures
Relations
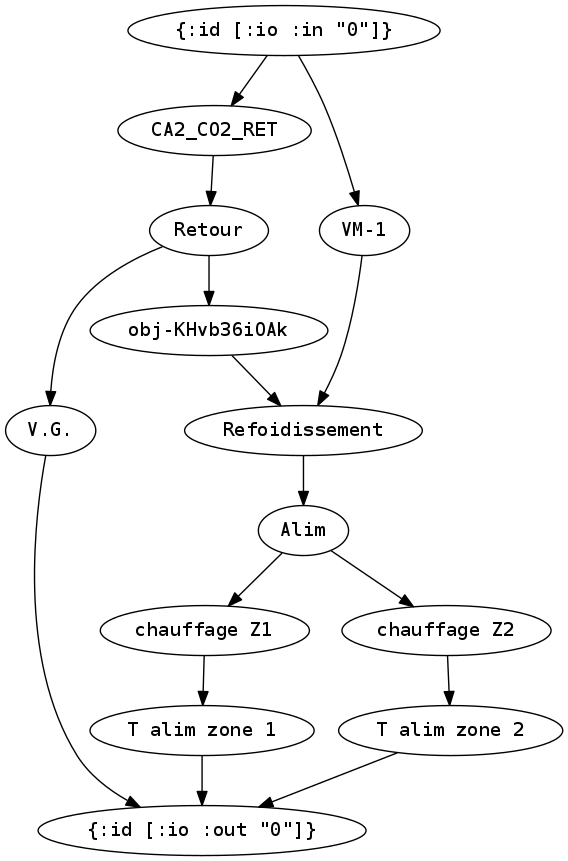
Under the hood, a powerful relation algorithm is building relations between all the components present on a grid.
(This feature is used by the SAEB mode to enable a much more precise analysis.)
Requirements
Client : A modern web browser
Server : Java 8
Installation
To see how to run your own Graphivac server, see Graphivac Server Installation.


